Reporting Automation · 8 min read · 16 June 2026
Building Financial Dashboards for Automated Reporting
Learn how to build financial dashboards that support automated reporting, reduce spreadsheet work, and help finance teams make faster decisions with Power BI or similar BI tools.
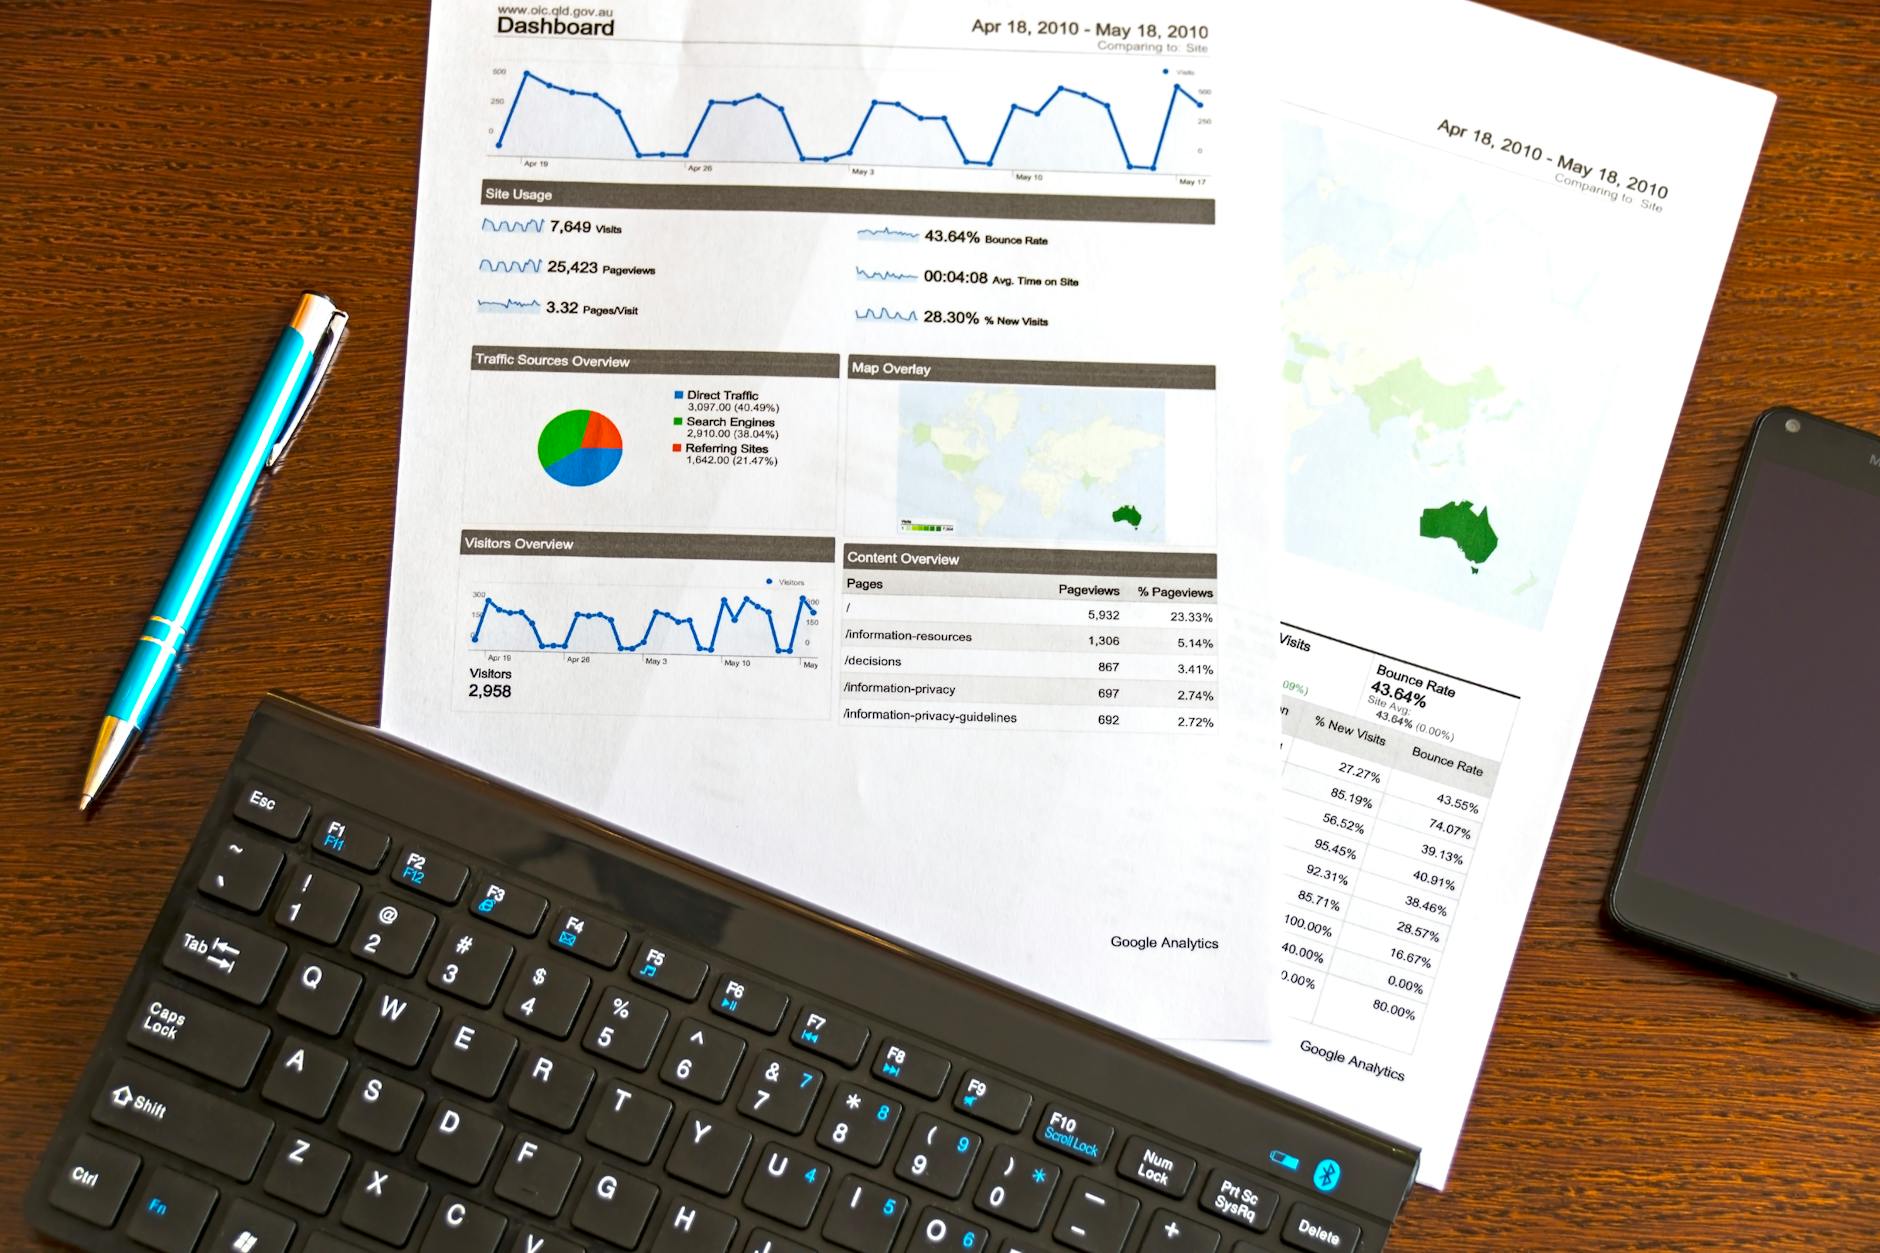
Financial dashboard reporting should do more than look polished. In a finance team, it needs to support recurring reporting, surface the right KPIs quickly, and make month-end and management reporting easier to run.
When dashboards are designed well, they reduce manual spreadsheet work and give CFOs, finance managers, and business owners a clearer view of performance. The goal is not more charts. It is cleaner reporting that people actually trust and use.
What dashboard reporting should do for a finance team
Good dashboard reporting gives finance teams a single place to monitor performance, spot exceptions, and prepare recurring reports without rebuilding the same numbers every month. It should answer the questions leadership asks most often: Are we on plan, where are the risks, and what needs attention now?
For that to work, the dashboard has to be practical. It needs to reflect the way finance actually operates, from the monthly close to forecast reviews and board reporting. A dashboard that looks impressive but forces manual refreshes will quickly become a burden rather than a tool.
The core components of a financial dashboard
Most effective finance dashboards combine a small number of high-value KPIs with clear context. That usually means a headline view, trend lines, variance analysis, and drill-downs that help users move from summary to detail without exporting data into spreadsheets. For a deeper framework on what separates effective dashboards from cluttered ones, see our financial dashboard best practices for business reporting.
If your reporting covers multiple entities, departments, or time periods, the dashboard should also standardise definitions. Revenue, gross margin, operating expense, cash balance, and forecast should mean the same thing every time they appear. That consistency is what makes automated reporting reliable.
- Headline KPIs: revenue, gross margin, EBITDA, cash, burn, or operating profit
- Variance views: actual vs budget, actual vs forecast, and prior period comparisons
- Trend analysis: monthly or weekly movement over time
- Operational detail: entity, department, cost centre, customer, or product breakdowns
- Exception flags: overdue items, unusual movements, or thresholds breached
Key KPIs to include for CFOs, finance managers, and business owners
The right KPIs depend on who is using the dashboard. CFOs usually need a strategic view of profitability, cash, and forecast accuracy. Finance managers often need close progress, reporting completeness, and variance explanations. Business owners and operations leaders tend to want a concise view of performance, liquidity, and the drivers behind change.
A strong dashboard reporting structure often separates executive KPIs from operational detail. That way, senior leaders can scan the top layer quickly, while analysts and managers can drill into the numbers behind the story. If you are deciding which reports to automate first, our guide on the first reports worth automating is a useful place to start.
- For CFOs: cash position, EBITDA, margin trend, forecast accuracy, and working capital
- For finance managers: close status, open tasks, reporting exceptions, and budget vs actual
- For business owners: sales trend, profit movement, cash runway, and key cost pressures
How to design dashboards that can be automated
Automation starts with structure. If your source data is inconsistent, the dashboard will inherit those problems. Before building in Power BI or another BI tool, finance teams should define data sources, data refresh timing, account mappings, entity structures, and the rules for each metric.
It also helps to design for repeatability. Use a layout that can be refreshed on schedule, with clear naming conventions, version control, and documented logic. If you are still spending time consolidating figures from different systems, our guide on bringing multiple platforms into one dashboard explains how to reduce that manual work. For teams ready to improve the process, explore our finance reporting services to see how we support dashboard design and reporting automation.
- Define source systems and ownership before building the dashboard
- Standardise chart of accounts mapping and metric logic
- Set refresh schedules that match reporting deadlines
- Document assumptions so reports can be maintained after handover
- Build drill paths that support review, not just presentation
Common data and reporting challenges that slow automation
Most dashboard projects run into the same issues: fragmented data, inconsistent definitions, manual workbook dependencies, and reporting that depends on one person’s spreadsheet knowledge. These problems do not disappear in a BI tool. They have to be resolved in the reporting design first.
Another common issue is trying to automate everything at once. Finance teams usually get better results by starting with one recurring report, stabilising the data model, and then expanding to additional dashboards. If you want a practical view of the time-saving opportunities, read how to cut down monthly reporting effort.
How Power BI and BI tools support dashboard reporting
Power BI and similar BI tools are useful because they separate reporting logic from presentation. That makes it easier to refresh data, reuse models, and keep dashboards aligned with the underlying finance systems. For teams managing recurring reporting cycles, that can significantly reduce the rework involved in monthly updates.
These tools also make it easier to build tiered reporting: executive summaries, operational views, and drill-through analysis in one environment. The tool matters, but the real value comes from how the dashboard is designed, governed, and maintained. If you want a broader view of automation impact, our article on measuring reporting automation value is a good follow-up read.
When to bring in a finance reporting partner
If your team is spending too much time fixing spreadsheets, reconciling report versions, or explaining why numbers do not match across dashboards, it may be time to bring in help. A finance reporting partner can shorten the learning curve, help structure the data model, and build dashboards that are easier for your team to own over time.
Reportingwise works with finance leaders who need dashboard reporting to be accurate, scalable, and practical. If you are evaluating a new reporting approach, the contact point for this micro-site is Reportingwise, and you can use the contact form to request a conversation. If you want to see how structured reporting support can fit into your wider finance workflow, you can also review our case studies for examples of the problems teams typically solve.
Key Takeaways
- Financial dashboard reporting should do more than look polished. In a finance team, it needs to support recurring reporting, surface the right KPIs quickly, and make month-end and management reporting easier to run.
- When dashboards are designed well, they reduce manual spreadsheet work and give CFOs, finance managers, and business owners a clearer view of performance. The goal is not more charts. It is cleaner reporting that people actually trust and use.
Frequently Asked Questions
What makes a financial dashboard useful for automated reporting?
A useful financial dashboard is built around stable data, clear KPI definitions, and a layout that supports recurring reporting. It should reduce manual work, make review faster, and give finance leaders a reliable view of performance.
Which KPIs should I include in a finance dashboard?
Start with the metrics leadership asks for most often. That usually means revenue, margin, cash, forecast accuracy, budget variance, and key operational or close-related indicators. Keep the list focused so the dashboard stays useful and maintainable.
Is Power BI enough for dashboard reporting?
Power BI can be a strong platform for dashboard reporting, but the tool alone will not solve reporting issues. The data model, metric definitions, refresh process, and governance all need to be designed properly for automation to work well.
When should a finance team get outside support?
Support is worth considering when dashboards are taking too much manual effort, data sources are hard to reconcile, or the team needs a cleaner reporting structure. A specialist can help design something more scalable and easier to maintain.