Power BI Dashboards
Discover how our custom Power BI dashboards tackle complex business challenges. Each example showcases the purpose, obstacles, innovative solutions, and measurable impact delivered — demonstrating the power of data-driven decision-making in action.
Cash is King
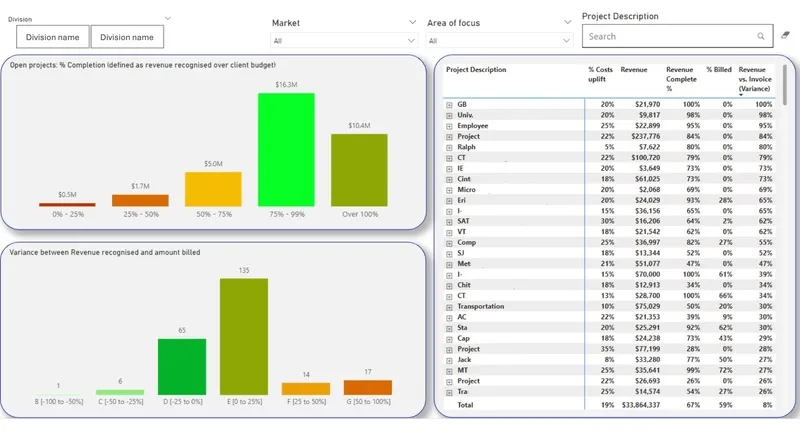
Dashboard that demonstrates significant improvements in working capital. Developed to help the business optimise cash flow and enhance financial decision-making.
Challenges
- Difficulty tracking cash flow across departments
- Inaccurate forecasting and budgeting
- Inefficiencies in accounts receivable and payable
- Lack of centralised financial data
Solutions
- Dashboard providing visibility on work completion, revenue recognition and billing
- Accurate forecasting models and automated budget tracking
- Streamlined AR/AP processes with detailed analysis
- Integrated multiple data sources for consolidated working capital view
Quantifiable Achievements
- Reduced DSO by 20%
- Enhanced working capital ratio by 10%
- 30% reduction in manual financial reporting
- Improved cash flow forecasting accuracy by 25%
Margins and Profitability
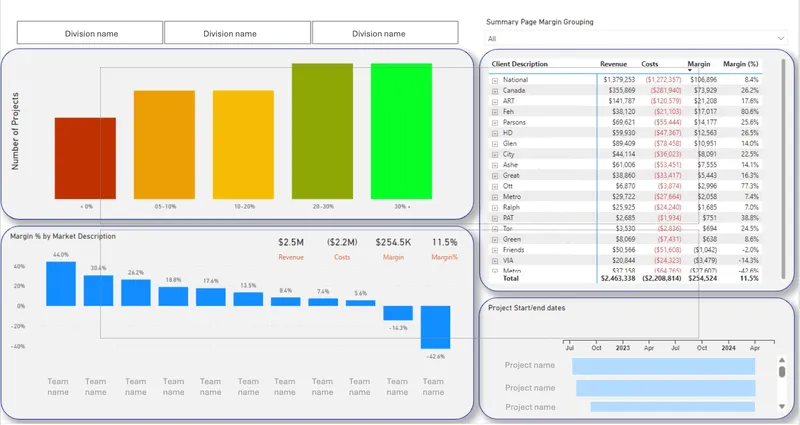
Dashboard that visualises margins per customer. Tool to help gain critical insights and drive profitability.
Challenges
- Difficulty identifying high & low-margin customers
- Time-consuming manual data analysis
- Inconsistent financial reporting
- Lack of actionable insights
Solutions
- Dynamic dashboard highlighting customer margin groups
- Automated data aggregation and visualisation
- Integrated multiple data sources for unified customer profitability view
- Interactive reports enabling drill-downs
Quantifiable Achievements
- Increased margins from 6.5% to 11.5%
- Renegotiated low-margin customer contracts
- Introduced discounts and rebates to increase working capital
- Increased commercial support to negative margin teams
Plan to Fail but don't Fail to Plan!
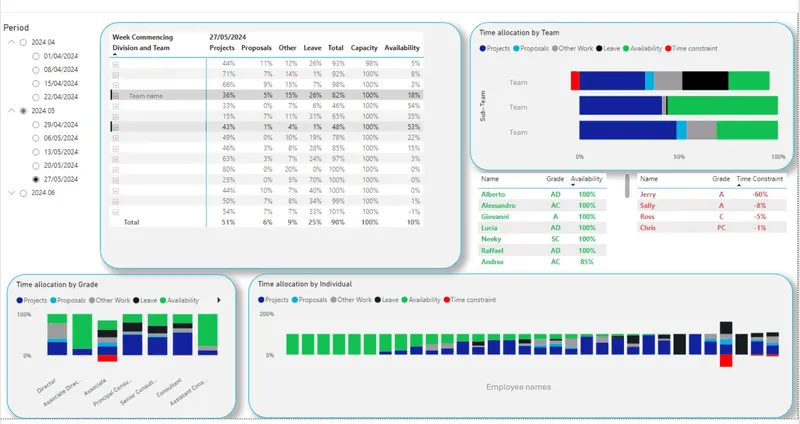
Dashboard visualising employee forecasted time allocation across activity types within a consulting business. Tool designed to help Operations manage resource allocation efficiently.
Challenges
- Inconsistent tracking of employee time allocation
- Difficulty balancing project utilisation and leave
- Lack of centralised data
- Inefficiencies in resource planning
Solutions
- Dashboard providing visibility into forecasted time allocation
- Automated reports monitoring utilisation, leave, proposals
- Integrated data sources for consolidated employee view
- Streamlined resource planning through predictive analytics
Quantifiable Achievements
- Increased project utilisation by 17%
- Reduced scheduling conflicts by 25%
- Improved forecasting accuracy by 30%
- 35% reduction in manual tracking efforts
Lead the Charge
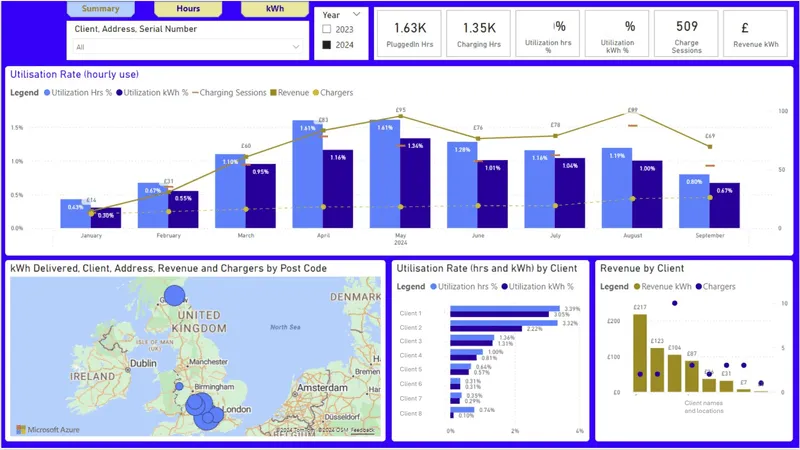
In the electric vehicle (EV) charging industry, real-time data-driven decisions drive profitability. A Power BI dashboard tailored for comprehensive metrics visibility.
Challenges
- Disconnected data sources from multiple locations
- Lack of visibility into charger utilisation
- Inefficiencies identifying underutilised stations
- Manual reporting prone to error
Solutions
- Centralised data collection across all charging points
- Dynamic dashboards with utilisation and revenue insights
- Visual mapping of charger locations with filters
- Automated real-time reports
Quantifiable Achievements
- 20% increase in charger utilisation
- 25% reduction in reporting time
- 15% revenue growth from optimised locations
- 30% decrease in maintenance costs
- Improved customer satisfaction
Generate More Revenue
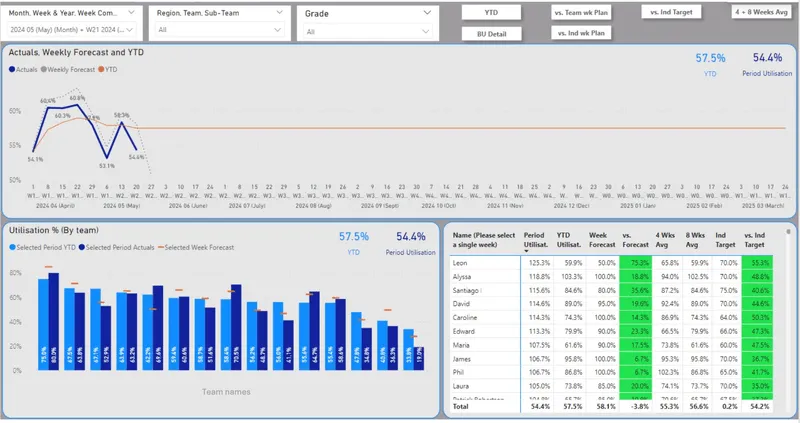
Dashboard showcasing consultant utilisation. Instrumental in helping consulting businesses optimise resource allocation and enhance profitability.
Challenges
- Inconsistent tracking of consultant hours
- Difficulty identifying underutilised resources
- Lack of centralised performance data
- Inefficiencies in scheduling
Solutions
- Dynamic dashboard showing division, team and consultant YTD + weekly utilisation vs plan
- Automated reports highlighting utilisation gaps
- Integrated multiple data sources
- Streamlined scheduling through predictive analytics
Quantifiable Achievements
- Increased consultant utilisation by 15%
- Reduced non-billable hours by 20%
- Improved project assignment efficiency by 25%
- 30% reduction in manual tracking
Toll Plazas Across India
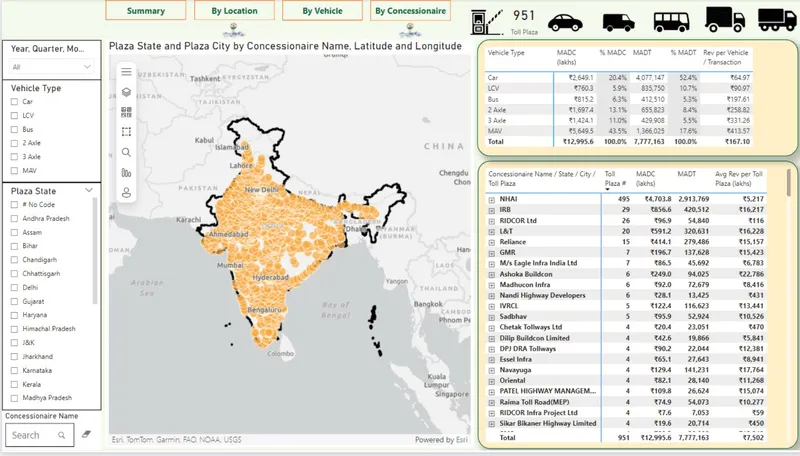
Tool to gain insights into revenue and transaction data, segmented by vehicle type and region, enhancing decision-making for toll plaza assets. Also used to case study new investments.
Challenges
- Difficulty aggregating revenue from multiple plazas
- Lack of visibility into vehicle-specific revenue
- Manual reporting inefficiencies
- Challenges identifying high/low performers
- Large growing Excel files
Solutions
- Centralised dashboard consolidating all plaza revenue
- Detailed analytics by vehicle type per plaza
- Automated data collection reducing manual effort
- Interactive visualisations identifying trends
Quantifiable Achievements
- Improved revenue tracking accuracy by 20%
- Reduced manual reporting time by 30%
- 15% improvement in operational efficiency
- Identified underperforming plazas contributing to 10% improvement
- Improved customer satisfaction
Power BI Dashboards Playground
Explore dynamic and interactive dashboards and have a look and feel of Power BI navigation. Our team will help you bring multiple data sources, structure it and allow you to filter and visualise in-depth insights. Dashboards are tailored to each business requirements. Start Exploring Now!
Sales Performance Overview
This dashboard visualises sales metrics, helping teams track performance, identify trends, and optimise strategies.
Play with DashboardPatient Health Insights
This dashboard provides a detailed view of patient health metrics, tracking trends and treatment outcomes.
Play with DashboardFinancial Performance Overview
This dashboard provides insights into financial metrics, tracking revenue, expenses, and profitability trends over time.
Play with DashboardFinancial Overview Dashboard
This dashboard visualises financial data, offering insights into revenue, expenses, and overall business performance.
Play with DashboardOperational Efficiency Dashboard
This dashboard tracks key operational metrics, optimising processes and improving overall business efficiency.
Play with Dashboard